One-Page Place Assessments
Watershed, Climate, Sun, Wind, Water, Watergy, & Totem Species info for where you live
Visit this page to download available One-Page Place Assessments listed by country, state, and city/town.
Each chart, where complete information is available, includes: Watershed, Sun, Climate, Wind, Water, Watergy, and Totem Species information. Please send us an email if you have citable sources to fill in missing data or improve upon existing information for any of these One-Pagers!
Visit this page for a guide on creating your own One-Page Place Assessment, or for rates for having us create one for you.
– – – – – – – – – – – – – – – – – – – – – – – – – – – – – – – – – – – – – – – – – –
The following explanation of the One-Page Place Assessment is an edited excerpt from Rainwater Harvesting for Drylands and Beyond, Volume 1, 3rd Edition:
The Watershed, Sun, Climate, Wind, Water, Watergy, and Totem Species information on the One-Page Place Assessment is an example of a brief starter-assessment of place—here, one page long. It is not at all an end, but rather a starting or germination point from which to deepen your investigation and roots. It fleshes out more of the context of the place in which your site is situated (not of the site itself), to better integrate your on-site assessment, harvest, and regeneration of water and other on-site and community resources.
Here are tips on how you can use the data within the One-Page Place Assessment, broken down into its subsections with illustrations from the One-Page Place Assessment—Tucson AZ. (More tips are in the One-Page Place Assessment and Use section of Appendix 5 – Worksheets, in Rainwater Harvesting for Drylands and Beyond, Volume 1, 3rd Edition.):
Watershed

A watershed is “that area of land, a bounded hydrological system, within which all living things are inextricably linked by their common water course and where, as humans settled, simple logic demanded that they become part of a community.” — John Wesley Powell
Political boundaries are arbitrary. Watershed boundaries are real. What we do, and how we live in a watershed affects all others in that same watershed; and what they do, and how they live affects us. See my blog post, Watershed Maps Are Community Maps, for strategies that help increase awareness of one’s watershed and its subwatersheds. This awareness can help strengthen our understanding of (and connections to) land, water, people, wildlife, and our shared ecologies and ecosystems.
Sun
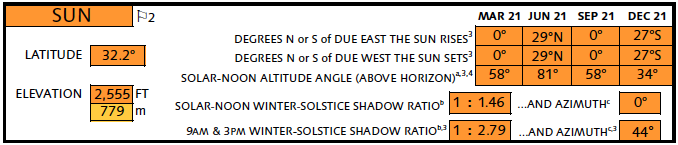
The Winter-Solstice Shadow Ratio, and locations of the sun when it Rises, at Solar Noon, and when it Sets are quick references that clue you into the sun’s seasonally changing path across the sky, and the shadows cast. With such information, you can better place objects such as trees and above-ground cisterns to cast cooling shade where you need and want it, without blocking access to winter sun where needed. Chapter 4 and appendix 7 of Rainwater Harvesting for Drylands and Beyond, Volume 1, 3rd Edition go into this far more thoroughly.
Latitude and Elevation, coupled with the Water and Climate info, are listed to help you create analog climate assessments. As Dave Boehnlein of Bullocks’ Permaculture Homestead (www.permacultureportal.com) describes, the process entails:
… creating a profile for the climate for which we are creating a design. This is based on precipitation, temperatures, seasonality, etc. Then we try to find other places around the world with profiles that match very closely: analog climates. Once we’ve found these different places we can start to analyze them in terms of native vegetation, agricultural products, medicines, architectural styles, cuisine, and a variety of other factors (especially with regard to traditional or indigenous peoples). As these people usually live in ways that are highly responsive to their environment (e.g., they harvest, rather than drain their local water; and design smart buildings that passively cool themselves instead of poor buildings that require mechanical air conditioning), we can look at what they grow and how they live as a source of inspiration for what types of design features we might use to best approach sustainability.
Climate
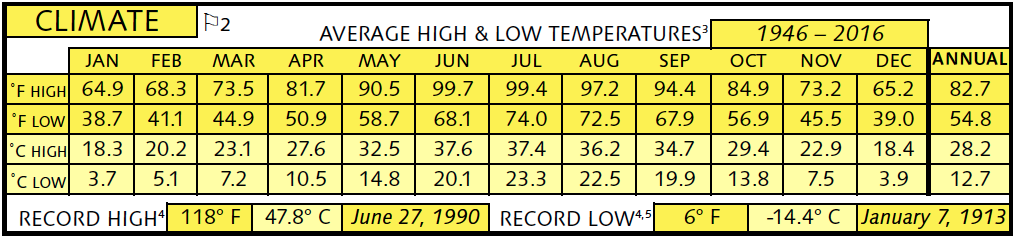
Average High and Low Temperatures are listed for each month of the year, along with Record High and Low Temperatures, so you can figure out:
• based on their heat and cold tolerances, what plants can survive/thrive in your area;
• when potential water loss to evaporation and evapotranspiration will likely be the greatest (during times of hotter temperatures and less rain), and therefore when anti-evaporation strategies such as shading, mulching, and windbreaks become extra important;
• what temperatures you can take advantage of, or modify using simple, low-cost, zero-power-consuming passive heating and cooling strategies.
In my place—Tucson, Arizona—winter low temperatures can and do drop below freezing, so frost-intolerant tropical and semi-tropical plants will die unless seasonally protected. Our hot summer temperatures also make life difficult for plants that are typically found at higher elevations and latitudes than Tucson’s (elevation and latitude are listed in the Sun section). USDA planthardiness/climate zone maps reflect this, and further help you determine what plants can tolerate your climate.
(You can also use these USDA plant-hardiness maps to see how our climate is changing. For maps that compare and illustrate differences between 1990 and 2012, go to www.washingtonpost.com/wp-srv/special/local/planthardinesszones/index.html. For the 1960 USDA Hardiness Zone Map, see https://www.ars.usda.gov/oc/images/photos/zonemap/d2493-1/. And for predicted future changes due to climate change see epa.gov/climatechange.)
Note the approximately 20° difference between temperatures in March (spring equinox) and September (fall equinox). The March highs and lows are warm and cold, and the September highs and lows are hot and cool. This suggests that Middle Eastern-style retractable awnings, shade cloth, or exterior blinds over equator-facing windows may be a good strategy to allow in more heat and light in winter and spring (when retracted), while shading out that direct sun and heat in summer and fall (when extended).
Chapter 4 of Rainwater Harvesting for Drylands and Beyond, Volume 1, 3rd Edition, explains how to implement this strategy.
If your site seasonally experiences a big temperature difference between hot days and cool nights, you can take advantage of this by opening screened windows and doors at night for free cooling, then closing them during the day to keep that coolth inside. This reduces power consumption for heating and cooling, which further reduces water consumption and polluting emissions. See Appendix 8 – Water, Energy, Carbon Nexus, of Rainwater Harvesting for Drylands and Beyond, Volume 1, 3rd Edition, and/or my own website’s Water–Energy–Carbon Nexus page for how.
Wind
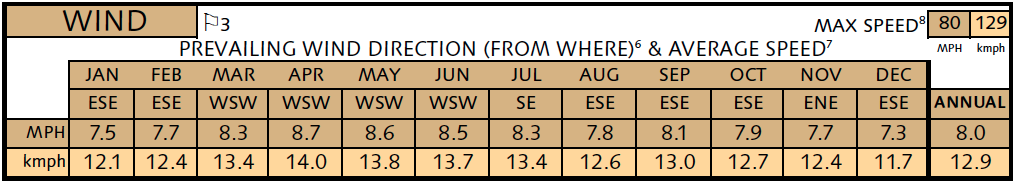
By knowing what direction prevailing winds come from, average and maximum wind speeds, and the seasonal variations in both, we can correctly place and design windbreaks, windows, roads, buildings and other features to harvest, divert, or deflect winds and what they carry.
Windbreaks and wind diversions, along with land forms, can concentrate, speed up, and enhance the harvest of wind for pumping or power. Windmills need a minimum wind speed of 3–4 mph (or 5–6.5 km/h) to pump water. Wind turbines need an average wind speed between 10–14 mph (or 16–22 km/h) to generate power (higher the better for higher electricity production).
Simpler harvests just slow the wind to drop wind-borne snow within shelterbelts that are irrigated by that snow, while keeping roads and driveways snow-drift-free; or they divert light, summer breezes through windows for free cooling. Windbreaks can also deflect cold winter winds around buildings and sometimes fires fueled by the wind; reduce evaporation and evapotranspiration water loss from protected plantings, soils, and water bodies; and filter and reduce the speed of otherwise dustier wind blowing on human settlements. See appendix 8 of Rainwater Harvesting for Drylands and Beyond, Volume 1, 3rd Edition for more.
Water
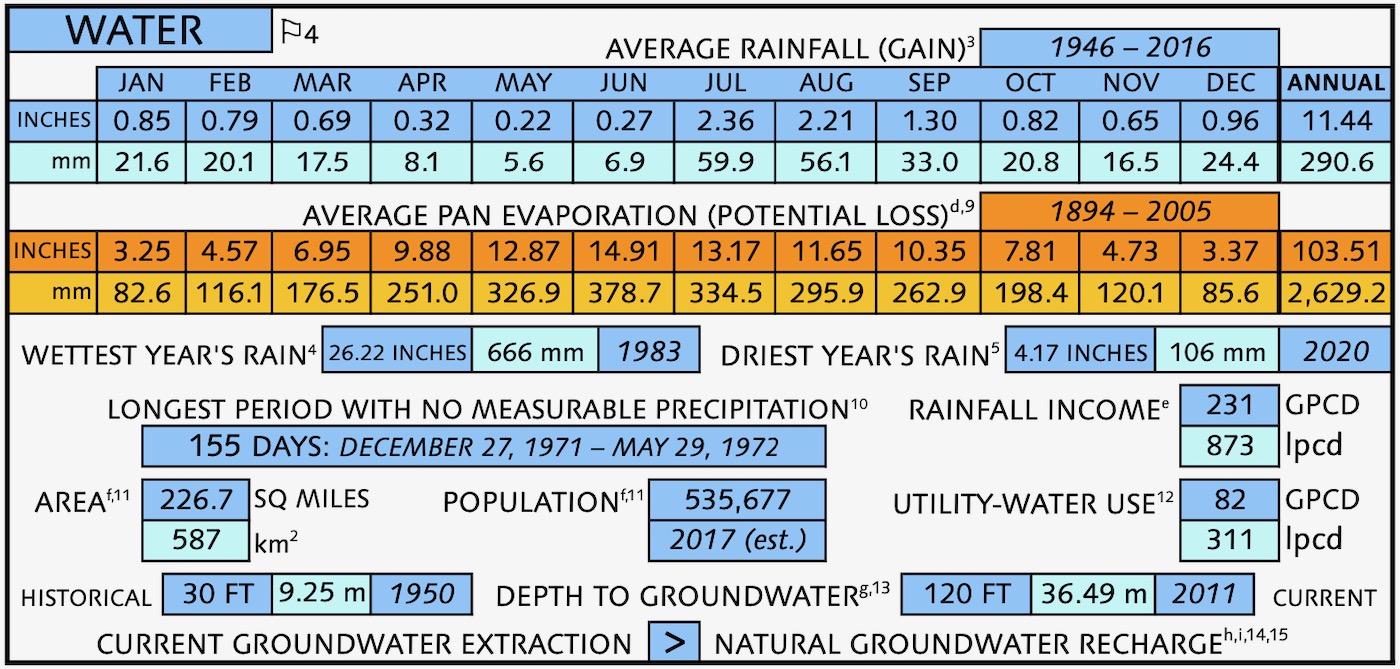
This section provides information on:
• Average Rainfall by month, so you know when you usually get it and how much;
• Wettest Year Rainfall, so you can plan for wet extremes and have enough capacity in soil, tanks, and overflow routes to turn potential floods into harvests;
• Driest Year Rainfall, so you can plan for and make it through dry extremes;
• Longest Period with No Measurable Precipitation, so you can size cisterns. You want enough water in your tanks on day one of that drought to last you through it, if you’re living solely on rainwater;
• Rainfall Income and Municipal Use in gallons per capita/person per day (GPCD) and in liters per capita/person per day (lpcd) so you can see the potential of rainwater harvesting in your community (rainfall on the community’s surface area typically exceeds the community’s water consumption).
Other measurements you may want to research and add to your own One-Page Place Assessment include historical groundwater table depths compared to current depths, or historical creek and river flows compared to those today. Start recording now, as these are benchmarks we can use in the future to determine progress or decline. For example, in 1939 a thirty-foot (9 m) deep hand-dug well would have hit water in my neighborhood, and our river, the Santa Cruz River, flowed year round. In 2011 the well would need to be 221 feet (67 m) deep to reach water, and the river flows for only a day or two after large rain events. So we Tucsonans must focus on efforts, such as water harvesting and conservation, along with restoring sponge-like soils of the watershed with water-absorbing, erosion-controlling native vegetation and organic matter, that can help raise well levels and extend surface flows without depleting the water available to others.
Watergy
![]()
Watergy is the relationship between pumped & treated water and the energy consumed in doing so. For more on watergy, and how to reduce your and your community’s water, energy, and carbon footprints through educated choices, see Appendix 9—Water-Energy-Carbon Nexus, of Rainwater Harvesting for Drylands and Beyond, Volume 1, 3rd Edition, and/or this website’s Water–Energy–Carbon Nexus page..
Totem Species
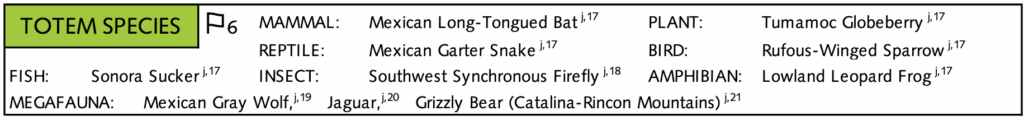
A totem species is an indigenous plant, mammal, insect, bird, fish, amphibian, or reptile whose role in your community is much like that of a canary in a coal mine. The decrease or increase of its numbers reflects the declining or improving health of a culture, a watershed community, and the ecosystem of which it is a part. The change in numbers alerts us to our need to help regenerate—or our success in regenerating—our mutual ecological habitat and community. In this way, we save and enhance the diversity of life which we all depend on and enjoy. For example, all species listed in the One-Page Place Assessment for Tucson, AZ, were formerly more common along the riparian habitats of our disappearing perennial and ephemeral water flows. However, Tumamoc globeberry is starting to make a comeback where it has been planted under native food-producing shade trees in street-side stormwater-harvesting basins.
See the new, full-color, revised editions of Brad’s award-winning books
– available a deep discount, direct from Brad: